
C++ lognormal_distribution 图片看不了?点击切换HTTP 返回上层
对数分布和表示随机变量的正态分布有关,这些值的对数分布是一个正态分布。对数分布是由期望和标准差定义的,但这些参数和变量无关,它们和变量的对数相关。具体来说,一个期望为 μ 标准差为 σ 的随机变量 x 的对数分布,说明 log x 是一个期望为 μ、标准差为 σ 的正态分布。图 1 展示了一个对数分布的曲线,以及改变期望和标准差时的效果。
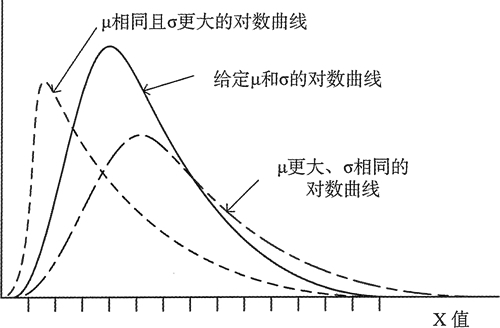
图 1 对数分布
对于大自然中的很多随机变量来说,对数分布比正态分布更接近概率的表示。病人的感染率就是一个对数分布模式。
lognormal_distribution 模板的一个实例定义了一个默认返回浮点类型值的对数分布对象。 下面是一个期望为 5.0、标准差为 0.5 的对数分布对象的定义:
构造函数的参数以 0 和 1 为默认值,因此省略了定义标准对数分布的参数。还有另一个构造函数,它接受封装了期望和标准差的 param_type 对象作为参数。
lognormal_distribution 对象也有所有分布类型都有的成员函数,如成员函数 m() 和 s(),它们分别返回期望和标准差。可以像看到的其他分布那样去使用这个对象,因此让我们在示例中试试它的用法。
下面是程序代码:
各位读者可自行拷贝代码查看运行结果。通过查看结果,可以看到对数的值是正态分布的,它是一幅标准差很小的狭窄图形。
图 1 对数分布
对于大自然中的很多随机变量来说,对数分布比正态分布更接近概率的表示。病人的感染率就是一个对数分布模式。
lognormal_distribution 模板的一个实例定义了一个默认返回浮点类型值的对数分布对象。 下面是一个期望为 5.0、标准差为 0.5 的对数分布对象的定义:
1 2 | double mu {5.0}, sigma {0.5};std::lognormal_distribution<> norm {mu, sigma}; |
lognormal_distribution 对象也有所有分布类型都有的成员函数,如成员函数 m() 和 s(),它们分别返回期望和标准差。可以像看到的其他分布那样去使用这个对象,因此让我们在示例中试试它的用法。
使用对数分布
为了不绘制不包含星号的行,这个示例会对前面章节中的函数模板 dist_plot() 做一点修改。这是因为对数分布曲线会有很长的尾巴,不需要去欣赏这个分布的形状。plot_data() 的最后一条语句为:1 2 3 4 | std::for_each(std::begin(plot_data), std::end(plot_data),[max_f, width](const std::pair<int, int>&v){ if ((width*v.second)/max_f > 0) std::cout << std::setw(3) << v.first << "-丨"<< string((width*v.second)/max_f,"*") << std::endl;}); |
1 2 3 4 5 6 7 8 9 10 11 12 13 14 15 16 17 18 19 20 21 22 23 24 25 26 27 28 29 30 31 32 33 34 35 36 37 38 39 40 41 42 43 44 45 46 47 48 49 50 51 52 53 54 55 56 57 58 59 60 61 62 63 64 65 66 67 68 69 70 71 72 73 74 75 76 | // Checking out lognormal distributions#include <random> // For distributions and random number generators#include <algorithm> // For generate(), for_each(), max_element(), transform()#include <numeric> // For accumulate()#include <iterator> // For back_inserter()#include <vector> // For vector container#include <map> // For map container#include <cmath> // For pow(), round(), log() functions#include <iostream> // For standard streams#include <iomanip> // For stream manipulators#include <string>using std::string;using Params = std::lognormal_distribution<>::param_type;// Template to plot a distribution from a range of sample valuestemplate<typename Iter>void dist_plot(Iter& beg_iter, Iter& end_iter, size_t width = 90){ // Create data for distribution plot std::map<int, size_t> plot_data; // Elements are pair<value, frequency> auto pr = std::minmax_element(beg_iter, end_iter, [](const double v1, const double v2) {return v1 < v2; }); for(int n {static_cast<int>(*pr.first)}; n < static_cast<int>(*pr.second); ++n) plot_data.emplace(n, 0); // Create the plot data std::for_each(beg_iter, end_iter,[&plot_data](double value) { ++plot_data[static_cast<int>(std::round(value))]; }); // Find maximum frequency to be plotted - must fit within page width size_t max_f {std::max_element(std::begin(plot_data), std::end(plot_data),[](const std::pair<int,int>& v1, const std::pair<int,int>& v2) { return v1.second < v2.second; })->second}; // Draw distribution as histogram std::for_each(std::begin(plot_data), std::end(plot_data), [max_f, width](const std::pair<int, int>& v) { if((width*v.second) / max_f > 0) std::cout << std::setw(3) << v.first << " -| " << string((width*v.second) / max_f, '*') << std::endl; });}int main(){ std::random_device rd; std::default_random_engine rng {rd()}; std::lognormal_distribution<> log_norm; double mu {}, sigma {}; const size_t sample_count {20000}; std::vector<double> values(sample_count); std::vector<double> log_values; while(true) { std::cout << "\nEnter values for the mean and standard deviation, or Ctrl+Z to end: "; if((std::cin >> mu).eof()) break; std::cin >> sigma; log_norm.param(Params {mu, sigma}); std::generate(std::begin(values), std::end(values), [&log_norm, &rng] { return log_norm(rng); }); // Create data to plot lognormal curve dist_plot(std::begin(values), std::end(values)); // Create logarithms of values std::vector<double> log_values; std::transform(std::begin(values), std::end(values), std::back_inserter(log_values),[] (double v){ return log(v); }); // Create data to plot curve for logarithms of values std::cout << "\nThe distribution for logarithms of the values:\n"; dist_plot(std::begin(log_values), std::end(log_values)); // Get the mean and standard deviation - for the logarithms of the values double mean {std::accumulate(std::begin(log_values), std::end(log_values), 0.0) / log_values.size()}; std::transform(std::begin(log_values), std::end(log_values), std::begin(log_values),[&mean](double value) { return std::pow(value - mean, 2); }); double s_dev {std::sqrt(std::accumulate(std::begin(log_values), std::end(log_values), 0.0) / (log_values.size() - 1))}; std::cout << "For generated values, mean = " << mean << " standard deviation = " << s_dev << std::endl; }} |