
piecewise_constant_distribution 图片看不了?点击切换HTTP 返回上层
图 1 中的分布定义了 3 个区间,每个都有自己的权重。这 3 个区间是由定义在容器 b 中的 4 个边界值定义的。每个区间都有一个由容器 w 中的元素定义的权重。它的前两个参数是指定边界序列的迭代器,第三个参数是指向权重序列的第一个元素的迭代器。每个区间内的值都是均勻分布的,特定区间内的随机值的概率是由这个区间的权重决定的。
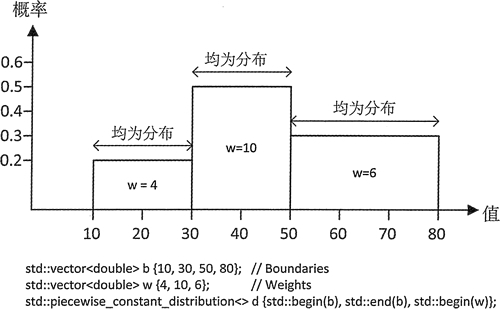
图 1 分段常数分布
除了所有分布都实现的成员函数之外,piecewise_constant_distribution 还有成员函数 intervals() 和 densities(),它们分别返回区间的边界和区间内值的概率密度;这两个函数返回的值都是 vector 容器。通过尝试和图 1 所示的相似的分布,我们可以运用这些成员,并深入了解这个分布的效果。但区间很狭窄,因此输出需要的空间很少:
1 2 3 4 5 6 7 8 9 10 11 12 13 14 15 16 17 18 19 20 21 22 23 24 25 26 27 28 29 30 31 32 33 34 35 36 37 38 39 40 41 42 43 44 | // Demonstrating the piecewise constant distribution#include <random> // For distributions and random number generator#include <vector> // For vector container#include <map> // For map container#include <utility> // For pair type#include <algorithm> // For copy(), count(), remove()#include <iostream> // For standard streams#include <iterator> // For stream iterators#include <iomanip> // For stream manipulators#include <string> // For string classusing std::string;int main(){ std::vector<double> b {10, 20, 35, 55}; // Intervals: 10-20, 20-35, 35-55 std::vector<double> w {4, 10, 6}; // Weights for the intervals std::piecewise_constant_distribution<> d {std::begin(b), std::end(b), std::begin(w)}; // Output the interval boundaries and the interval probabilities auto intvls = d.intervals(); std::cout << "intervals: "; std::copy(std::begin(intvls), std::end(intvls), std::ostream_iterator<double>{std::cout, " "}); std::cout << " probability densities: "; auto probs = d.densities(); std::copy(std::begin(probs), std::end(probs), std::ostream_iterator<double>{std::cout, " "}); std::cout << '\n' << std::endl; std::random_device rd; std::default_random_engine rng {rd()}; std::map<int, size_t> results; //Stores and counts random values as integers // Generate a lot of random values... for(size_t i {}; i < 20000; ++i) ++results[static_cast<int>(std::round(d(rng)))]; // Plot the integer values auto max_count = std::max_element(std::begin(results), std::end(results),[](const std::pair<int, size_t>& pr1, const std::pair<int, size_t>& pr2) { return pr1.second < pr2.second; })->second; std::for_each(std::begin(results), std::end(results),[max_count](const std::pair<int, size_t>& pr) { if(!(pr.first % 10)) // Display value if multiple of 10 std::cout << std::setw(3) << pr.first << "-|"; else std::cout << " |"; std::cout << std::string(pr.second * 80 / max_count, '*')<< '\n'; });} |
该程序的输出如下:
intervals: 10 20 35 55 probability densities: 0.02 0.0333333 0.015
10-|***********************
|***********************************************
|****************************************
|*******************************************
|**********************************************
|********************************************
|**********************************************
|**********************************************
|***********************************************
|********************************************
20-|**********************************************************
|************************************************************************
|**************************************************************************
|***************************************************************************
|******************************************************************************
|*****************************************************************************
|********************************************************************************
|***********************************************************************
|****************************************************************************
|***************************************************************************
30-|**************************************************************************
|*******************************************************************************
|******************************************************************************
|*************************************************************************
|***************************************************************************
|*******************************************************
|**********************************
|*********************************
|******************************
|***********************************
40-|***********************************
|**********************************
|********************************
|*******************************
|******************************
|***********************************
|*********************************
|******************************
|********************************
|**********************************
50-|*************************************
|*******************************
|*********************************
|*********************************
|*********************************
|***************
原因在于它们是不同的。概率密度是区间内给定值出现的概率,而不是随机值出现在区间内的概率,一个值的概率密度与区间值出现概率除以区间的值的范围是对应的。因此,这个 3 个区间内值的概率密度分别为 0.2/10、0.5/15、0.3/20,幸运的是,这和输出是相同的。最后一个区间得到的值恰好是第一个区间的两倍,但它所跨越的范围更大,因此条形图更短。因此,条形图的长度反映了概率密度。